Orientation Effects on Spectral Emission features of quasars
The well know and accepted Unified Model for Active Galactic Nuclei (AGN) predicts that all AGNs have similar components with the orientation being one of the main drivers for the different phenomenologies seen in this class of objects.
Due to the morphology of Active Nuclei –shown in Figure 1—the angle of sight plays a major role for detecting the regions from which emission lines are produced.
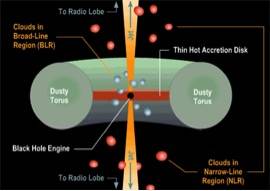 |
| Figure 1: AGN Unified Model. Credits: Brooks/Cole Thomson Learning via AstronomyOnline.org |
An indicator of the orientation of quasars has been for a long time chased, although not univocally identified. Few years ago, Guido Risaliti, based at the University of Florence, suggested to use the equivalent width (EW) of the [OIII] line at 5007Å as an orientation indicator.
The use of such an indicator can be very powerful because, in case of non-isotropic emission, it allows us to study the characteristics of the emission features to get information about the geometry and the kinematics of the emitting regions themselves.
Starting from the results of Risaliti, Susanna Bisogni, a PhD student of the Observatory of Arcetri, has tested the reliability of EW [OIII] as an orientation indicator on a very large sample (~12000 quasars) of the SDSS DR7. The behaviour of narrow and broad lines confirmed the presence of orientation effects on both emission lines.
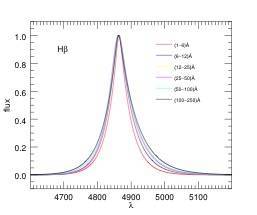
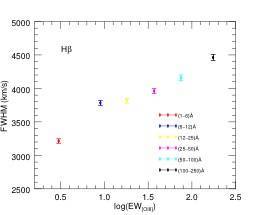
The width of broad lines, such as Hβ, increases moving from spectra with low to high EW [OIII] (from face-on to edge-on position) (Figure 2), confirming, as already suggested by models that this region is rather shaped as a disk than being spherical as usually depicted in the AGN Unified Model.
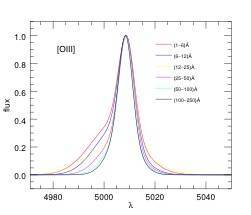
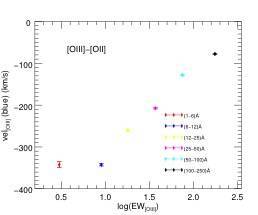
The profile of the [OIII] narrow line instead shows a prominent blue tail in the low EW stacks (face-on positions) that decreases moving to high EW values (edge-on positions) (Figure 3), confirming the presence of gas in outflow in it.
|
Figure 2: Left panel: Hβ broad component. Right panel: Full width half maximum of the Hβ broad component as a function of EW[OIII]. |
|
Figure 3: Left panel: [OIII] line profile. Right panel: velocity of the [OIII] blue component with respect to the systemic velocity of the host galaxy (v[OII]) as a function of EW[OIII]. Negative values for the velocity mean that the gas is outflowing in our direction. |
This indicator can be further employed to understand the geometry and kinematics of the inner components of AGN. The group is still working on applications of this important result.
References:
Risaliti et al. 2011 http://adsabs.harvard.edu/abs/2011MNRAS.411.2223R
Bisogni et al. 2017 http://adsabs.harvard.edu/abs/2017MNRAS.464..385B


