Synchrotron emission in molecular cloud cores: the SKA view
Understanding the role of magnetic fields in star-forming regions is of fundamental importance. In the near future, the exceptional sensitivity of the Square Kilometre Array (SKA) will offer a unique opportunity to evaluate the magnetic field strength in molecular clouds and cloud cores through synchrotron emission observations.
During the last decades, many observational techniques have been developed to gather information on the magnetic field strength and geometry in molecular clouds and star-forming regions such as Zeeman splitting of hyperfine molecular transitions, optical and near-infrared polarisation of starlight, polarisation of sub-millimetre thermal dust emission, maser emission polarisation, Goldreich–Kylafis effect, and Faraday rotation. Together, all these techniques contribute to elucidating the still controversial role of magnetic fields in the process of star formation.
An additional method to probe magnetic fields in molecular clouds is via synchrotron radiation produced by relativistic electrons braked by a cloud’s magnetic fields. The intensity of the emission depends only on the electron density per unit energy and the projection of the magnetic field on the plane perpendicular to the line of
sight. However, this technique was constrained by two limitations: the poor knowledge of the interstellar flux of cosmic-ray electrons below about 500 MeV and the limited sensitivity of current radio telescopes.
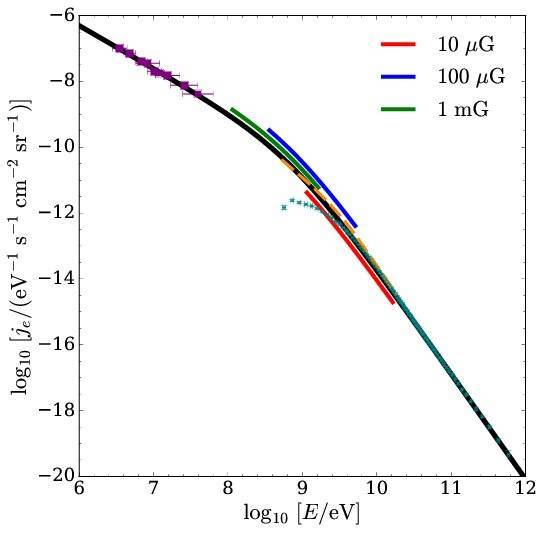
Today, thanks to the latest data release of the Voyager 1 spacecraft, the flux of cosmic-ray electrons down to about 3 MeV is well known (see Fig. 1). On the instrumental side, with the advent of the Square Kilometre Array (SKA), we are now approaching a new important era for high resolution observations at radio frequencies.
Marco Padovani, AstroFIt2 fellow, and Daniele Galli of the INAF-Osservatorio Astrofisico di Arcetri, in a recently published paper (Padovani & Galli 2018) explored the capability of SKA in detecting synchrotron emission in two starless molecular cloud cores in the southern hemisphere, Barnard 68 in Ophiuchus and FeSt 1-457 in the Pipe Nebula, finding that it will be possible to reach signal-to-noise ratios of the order of 2−23 at the lowest frequencies observable by SKA (60−218 MHz) with one hour of integration (see Fig. 2).
They also found a typical spectral index alpha=(p−1)/2 ~0.6, intermediate between the values 0.2 and 1.1 resulting from the low- and high-energy asymptotic slopes p of the primary cosmic-ray electron flux. Since in starless cores the interstellar cosmic-ray electron flux is not attenuated by losses, the authors expect alpha ~ 0.6 to be a universal quantity, weakly dependent on density and magnetic field strength profiles at SKA1-Low frequencies.

Fig.1: Flux of interstellar cosmic-ray electrons (black solid line) as a function of energy. Data: Voyager 1 (solid purple squares) at low energies, AMS-02 (solid cyan circles) at high energies. The red, blue, and green thick lines show the energy range that mostly contributes to synchrotron emission in the frequency range of SKA for the values of the magnetic field strength listed in the legend. The orange dashed line shows the cosmic-ray electron-positron flux obtained from Galactic synchrotron emission.

Fig.2: Radial flux density profiles for Barnard 68 (B68) and FeSt 1-457. The observing frequency is shown in black at the top of each column, while numbers in the upper-right corner of each subplot represent the radius-averaged signal-to-noise depending on the assumption on the magnetic field strength profile. The telescope beam is shown in the leftmost column for B68 (short-dashed black line, 330") and FeSt 1-457 (long-dashed black line, 284"). Hatched areas display SKA sensitivities for one hour of integration at different frequencies. The rightmost panel shows the flux density as a function of frequency. Empty (solid) circles refer to a signal-to-noise smaller (larger) than 3, respectively. The spectral index alpha is shown on the right of each curve.
Marco Padovani acknowledges funding from the European Unions Horizon 2020 research and innovation programme under the Marie Skłodowska-Curie grant agreement No 664931.


