Modelling Pulsar Wind Nebulae in 3D
Pulsar Wind Nebulae are a particular class of supernova remnants, characterized by the presence of a fast spinning neutron star -the pulsar- lying in the slowly expanding debris of the progenitor explosion. The interaction between the cold, relativistic, magnetized leptonic plasma emanating from the pulsar (the so-called “pulsar wind”) with the surroundings generates a strong reverse magneto-hydrodynamic shock, which “terminates” the pulsar wind. At the termination shock, the wind is heated and slowed down to match the expanding velocity of the supernova ejecta at the nebula outer edge; its bulk energy is efficiently dissipated and it goes into accelerated particles, which are responsible for the observed non-thermal emission across the electromagnetic spectrum.
For their particular properties, Pulsar Wind Nebulae represent the perfect laboratory to investigate the physics of relativistic and magnetized plasmas.
Since they shine with luminosities that represent a substantial fraction of the energy produced by the pulsar in its spin-down, the modelling of these nebulae provides the stronger constraints on the amount of particles produced in their magnetospheres. This will have important consequences both on pulsar physics, in general, and in our understanding of the positron excess revealed in the cosmic ray spectrum with PAMELA (Payload for Antimatter Matter Exploration and Light-nuclei Astrophysics) and AMS02 (Alpha Magnetic Spectrometer), since pulsars are candidate as primary antimatter factories in our Galaxy.
In the last decade relativistic two-dimensional magneto-hydrodynamical (2D MHD) numerical modelling of Pulsar Wind Nebulae has been very successful to account for many of the observed features of the Crab Nebula, the class prototype, down to the finest details.
Nevertheless many aspects are still not understood. At present 2D models have probably reached their natural limit, and a more realistic (and complex) 3D representation seems to be mandatory.
Following the first attempt to a full 3D modelling of the Crab Nebula (Porth et. al 2013, 2014), the high-energy group in Arcetri and their collaborators have recently implemented their own 3D simulation based on the PLUTO code (Mignone et al. 2007).
In a recent paper published in the Journal of Plasma Physics, Barbara Olmi, a PhD student at the Osservatorio di Arcetri, and collaborators, including Luca del Zanna (University of Florence), Elena Amato and Niccolo' Bucciantini (INAF-Osservatorio di Arcetri), have achieved a first important goal with their 3D model, obtaining a comprehensive representation of the Crab Nebula dynamics in a self-similar expansion phase. This is particularly important, since a realistic representation of the magnetic field is one of the most significant lacks of 2D models.
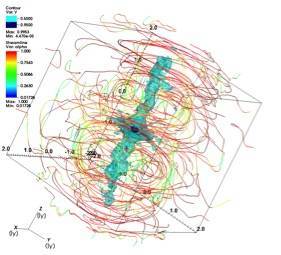
In 3D the magnetic field is correctly reproduced, and the different regions of influence of its poloidal/toroidal components can be easily identified in Fig. 1.
 |
|
Figure 1. Magnetic field lines at an evolution time of 250 yr. The contrast between toroidal and poloidal components is highlighted by the colour scale (α=Btor/B): blue colour means that the field is completely poloidal while red colour that the field is completely toroidal.
|
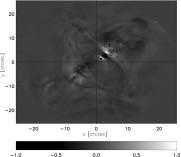
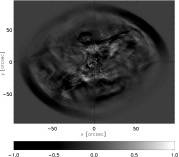
The model is also able to reproduce the arc-like moving features at radio frequencies (called “wisps”) both in the inner nebula and in the whole nebula. They can be seen in Fig. 2 as a sequence of consecutive light and dark arcs. Wisps form near to the pulsar location and, as expected, they appear to be more prominent in the upper hemisphere rather than in the lower one. Wisps in the inner nebula are similar to those obtained via 2D simulations, while a number of non-axisymmetric structures appear at larger scales, showing a much closer resemblance to the time variability data reported in the observations of Bietenholz et al. (2004).
The 3D model by Barbara Olmi and collaborators represent the first example of a long-term simulation of the Crab Nebula, which should be finally able to infer precise information on the suitable set of parameters that allow us to reproduce the morphology and multi-wavelength spectrum of the Crab Nebula.
|
||
>Figure 2. Map of the wisp-like features in the inner (left side) and whole (right side) nebula. The images are obtained as the difference between two surface brightness maps at radio frequencies separated by a time interval of 5 years around t=250 yr. The black crosses identify the pulsar location.
Reference: “Multi-D magnetohydrodynamic modelling of pulsar wind nebulae: recent progress and open questions”, Journal of Plasma Physics, Vol. 82, Issue 6, Id. 635820601, Published 12/2016. B.Olmi, L. Del Zanna, E. Amato, N. Bucciantini, A. Mignone.


