A 10-M⊙ YSO with a Keplerian disk and a nonthermal radio jet
In the last decade, high-angular-resolution observations have clearly indicated that the formation of low-mass up to intermediate-mass stars follows a common route, involving accretion disks and jets. However, towards high-mass (M ≥8 M⊙) young stellar objects (YSO), the detection of both the disk and the associated jet is still relatively rare. Observing the full disk+jet system is fundamental to study the connection between accretion and ejection and, in particular, to determine the mechanism responsible for launching and collimating the protostellar jet.
In September 2016, an international group of astronomers employed the Atacama Large Millimeter Array (ALMA) to observe the star-forming region (SFR) G16.59-0.05 at high-angular resolution. The data obtained with ALMA have been recently published in an article [1] led by Luca Moscadelli with the participation of Riccardo Cesaroni and Victor M. Rivilla (INAF – Arcetri Astrophysical Observatory).
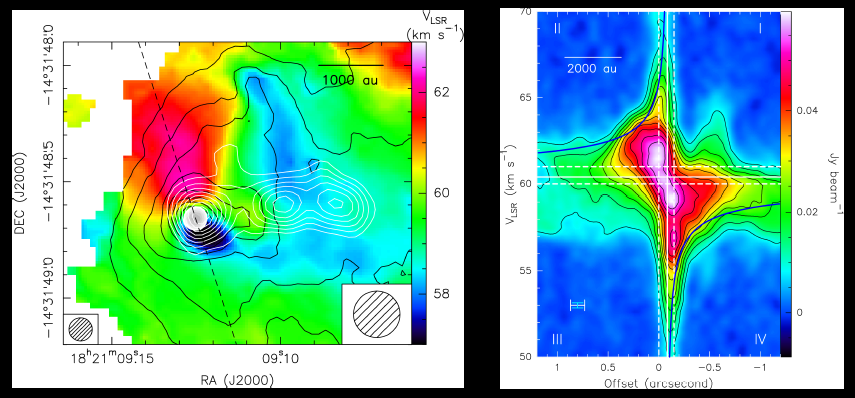
Previous sensitive Jansky Very Large Array (JVLA) observations detected a radio jet emerging from a massive YSO in G16.59-0.05 (in the following referred to as Bm), elongated ≈3” along the E-W direction [2,3]. The recent ALMA data reveals that a well-defined SW-NE velocity (Vlsr) gradient is revealed at the position of Bm in all the observed high-density gas tracers. Looking at Fig.1 (left panel), the JVLA 22-GHz continuum, pinpointing the YSO, falls just between the SW blueshifted and the NE red-shifted line emission, and the direction of the Vlsr gradient forms a large (≈70o ) angle with the radio jet traced by the extended JVLA 13-GHz continuum. These findings suggest that the Vlsr gradient can be due to rotation of the gas in an envelope and/or disk surrounding the YSO.

Fig.1: Left panel: the black contours and the color map show, respectively, the velocity-integrated intensity and the intensity-averaged velocity of the C34S J = 5─4 line (Eu = 28 K). The gray-scale filled and white contours show the JVLA 22 GHz and 13 GHz continuum emission, respectively.
Right panel: P-V plot of the C34S J = 5─4 line. The cut (at PA = 18 deg) along which positions are evaluated is indicated with the dashed black line in the left panel. The blue curve marks the Keplerian profile around a YSO of 10 M⊙.
The P-V plot (Fig.1, right panel) produced along the axis (at PA = 18o ) of the Vlsr gradient confirms that envelope-disk rotation is actually observed. The P-V plot has a butterfly-like shape, with well-defined "spurs" at high absolute velocities and small offsets in the second and fourth quadrants. These spurs correspond to gas whose line of sight velocity increases with decreasing radius and are consistent with Keplerian rotation.
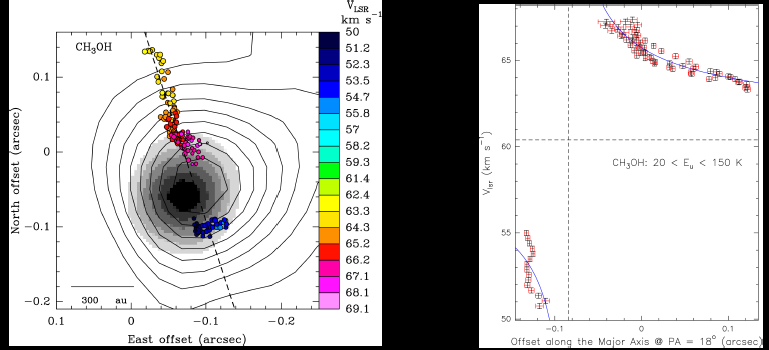
Since the molecular emission at high velocities is quite compact, it is possible to fit a 2D Gaussian profile and determine the peak position at each velocity channel. Figure 2 (left panel) shows that the spatial distribution of the high-velocity emission of CH3OH is elongated at PA = 18o ± 3o, which can be taken as the direction of the major axis of the molecular disk around the high-mass YSO Bm. Along the red-shifted side, ≈0.15” or ≈500 au in extent, the gas Vlsr increases monotonically approaching the YSO, ranging from ≈62 km s-1 up to ≈69 km s-1 .
Figure 2 (right panel) plots Vlsr versus positions projected along the disk major-axis, and shows the best-fit Keplerian curve. The derived value for the YSO mass is M sin2(i) = 10 ± 2 M⊙ , where i (60o ≤ i ≤ 120o) is the inclination of the disk rotation axis with the line of sight. Inside the disk radius of ≈500 au, the 1.2-mm continuum flux is 42 mJy, corresponding to ≈1 M⊙. Since this value is much less than the YSO mass ≈10 M⊙, the choice of fitting a Keplerian velocity profile appears to be well justified a posteriori.
In conclusion, through high-angular-resolution and sensitive ALMA and JVLA observations a disk+jet system around a 10-M⊙ YSO has been discovered in the SFR G16.59-0.05, and its geometrical properties (orientation and extension) determined. This is a promising target to study the interplay among a massive YSO, the disk and the jet..

Fig. 2: Left panel: The disk around the high-mass YSO Bm. Colored dots indicate the peak positions of the most blue- and red-shifted velocity channels for the emission of nine unblended CH3OH lines with 20 K ≤ Eu ≤ 900 K. Colors represent Vlsr as coded on the right of the panel. The dashed black line, at PA = 18o, shows the linear fit to the spatial distribution of the channel peaks. The gray-scale filled and black contours represent the JVLA 22- and 13-GHz continuum, respectively, with the same levels as in Fig.1. Right panel: Black and red errorbars give, respectively, major-axis projected positions and Vlsr (together with the corresponding errors) for the highest-velocity emission peaks of six CH3OH lines with 20 K ≤ Eu ≤ 150 K. The blue curve is the best Keplerian fit to the data.
References:
[1] Moscadelli, L. et al. 2019, A&A in press
[2] Moscadelli, L. et al. 2013, A&A 558, A145
[3] Moscadelli, L. et al. 2016, A&A 585, A71.


